An Infographic is
a visual image such as a chart or diagram used to represent information or data. An infograph can be used to display information in a visual way. It also gives a fun way of showing information about a certain topic with less boring words and more pictures. Data and statistics are best for being used ini an infographic. The graph can visually stimulate the viewers eyes with a graph or other template of your data. If the data is confusing the audience with big words the audience can easily understand with pictures showing what they are talking about. I might use infographs in my projects for school cause it can make them visually pleasing. In sophomore ELA last year i had to due a infographic project. I can also use infographics in my career when i am older for a meeting or a presentation about my job. Infographic are the new and improved way of presenting info to a group of people.
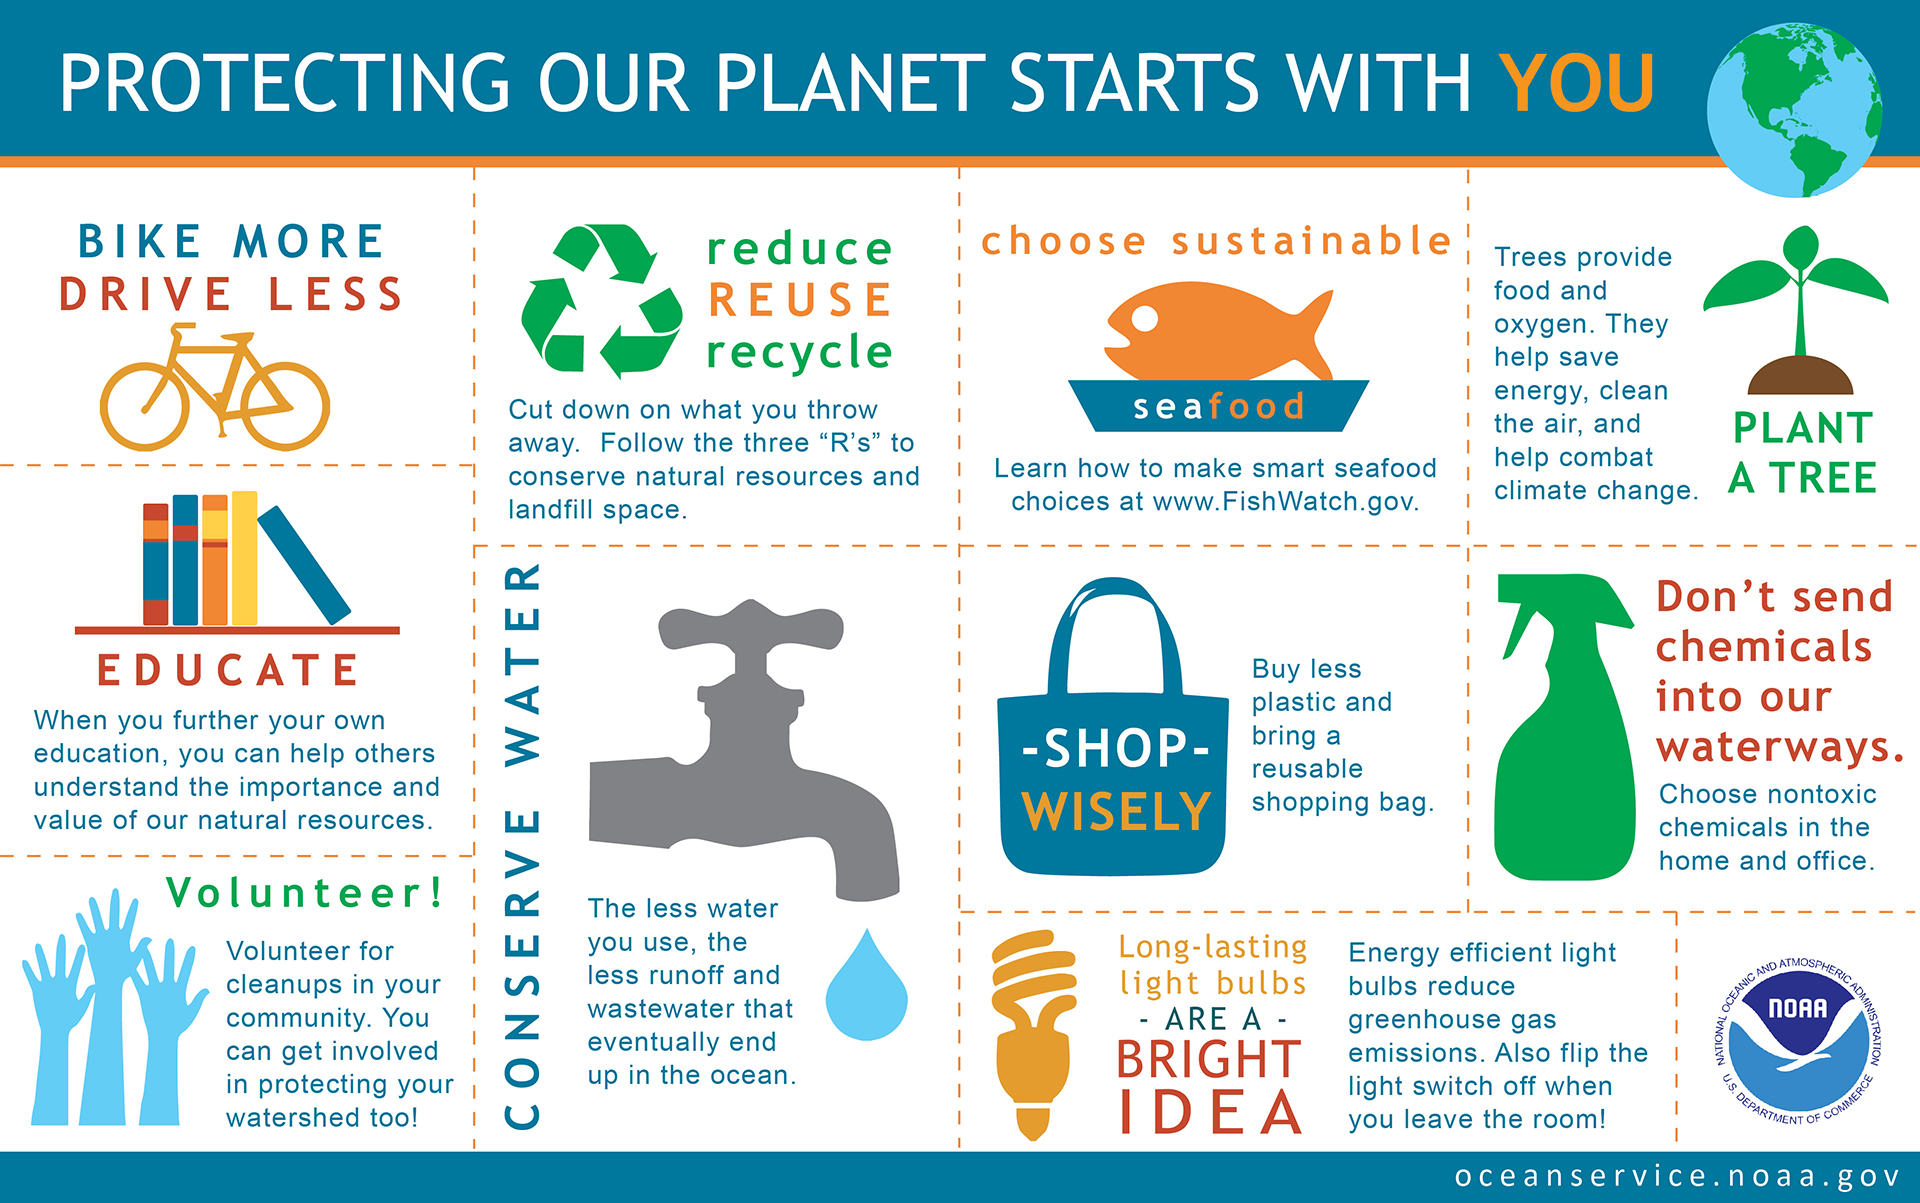
http://oceanservice.noaa.gov/infographics/

http://www.ericrettberg.com/datacultg2/tag/infographic/
No comments:
Post a Comment